Table of Contents
T-S Diagram
Author: Deyan Poffet, Romina Rulli
Definition
T-S diagrams are graphic representations of two main properties of water masses: Temperature and salinity. Usually, the salinity is plotted on the X-axis and the temperature on the Y-axis. Those two properties are the main factors of a third one, the density. The latter is thus also represented on the graph by addition of curves of equal density (isopycnic or iso-density lines). The range of values represented on a T-S diagram covers most of the time the values found in the different oceans. The temperature axis (Y-axis) usually range from 0°C to 25°C and the salinity axis (X-axis) from 34 to 36.
Temperature
The temperature parameter used is called in-situ temperature, which is the real temperature of the water measured with instruments inside the water mass; so to say “on the spot”. It is opposed to the potential temperature θ that is the temperature of a water mass after adiabatic decompression down to atmospheric pressure.
Density
The density is usually written as sigma-t or density anomaly: σt=(ρ-1000)[kg/m^3]. The density is much more sensitive to the temperature than to the salinity when the temperature of the water mass is higher than 5°C. This is apparent by the fact that isopycnic lines have low slopes (smaller than one) for temperatures above 5°C. As expressed by Suckow et al., a change of 1°C in temperature has more influence on density than a change of 0.1 in salinity. This characteristic make the temperature predominant for evaluation of water stability and stratification, but the still relative important influence of salinity does not permit to get rid of this factor. On the other side, in high latitudes where water is colder and often under the 5°C limit, the salinity becomes much more important in the computation of the density (isopycnic lines have a higher slope). These regions are often influenced by input of cold fresh water from ice and thus make the salinity factor even more relevant.
Conservative properties
Temperature and salinity are frequently used because they are so-called conservative properties. This means that, except at the interface water/atmosphere (surface), there is no processes other than mixing that can change these properties. In oceans, it means that a water mass with defined salinity and temperature will remain with the same properties unless it mixes with another water mass with other properties. This characteristic of temperature and salinity allows the use of T-S diagrams to track different water masses in an ocean profile (see “applications”).
Figure 1
 Reference: Mark A. Suckow, Steven H. Weisbroth, Craig L. Franklin (1995). Seawater:
Its Composition, Properties and Behaviour
. Open University. page 47.
Applications
T-S diagrams are used as illustration means and visual tools and have different applications as evaluation of stability of a water column or identification of different water masses in a profile.
Stability and stratification
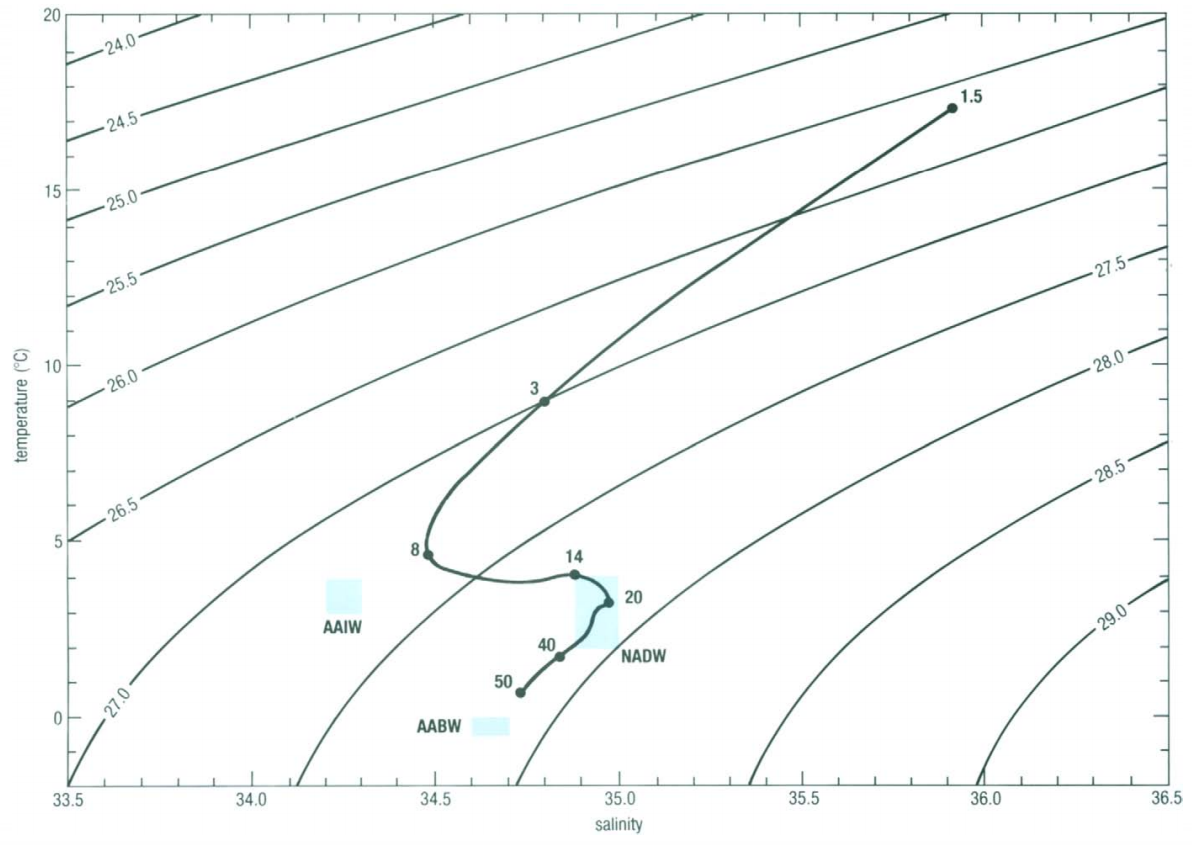
Representing the properties of samples collected at different depths in a water column can help to define if the water is stable, strongly stratified or unstable. As visible on figure 1, linking the different samples with a line illustrate the evolution of density in the water profile. The more this line moves across isopycnic lines, the more the density increase with increasing depth (or decrease with decreasing depth). A profile line perpendicular to the isopycnic lines, as on the top layer in figure 1, shows a quick increase of density with depth and thus a strong stratification. Opposite, a profile line parallel to isopycnic lines or even looping back to smaller densities illustrate an instability in the profile and likely a mixing taking place. This case is also visible in figure 1 between the points 20 and 50. Wrong conclusions can be drawn from T-S diagrams at high depths because of the divergence between in-situ temperature and potential temperature. A situation that seems instable might be stable in reality. For more details, see section “potential temperature”.
Identification of water masses
As temperature and salinity are highly conservative parameters, they can be used to characterize and recognize different water masses. For instance, the Antarctic Bottom Water (AABW) shows properties that are very stable: T=-0.5°C-0°C, Salinity=34.6-34.7. If this signature is encountered in a water profile, it is quite safe to assume that the AABW is flowing at the specific depth. On figure 1, three different water that are likely to be found in the profile are shown as blue squares.
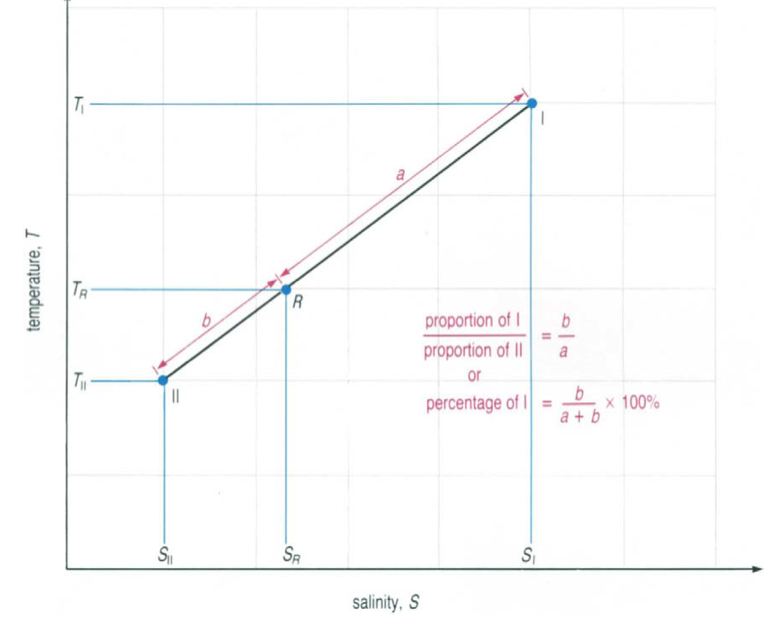
A water type can be formed by the mixing of two other given water types. It is easy to determine the percentage of the two water types in the new water type: All three water types should lie on a straight line in the T-S diagram. The new water types (R in figure 2) is found in-between the other two water types. The percentages of the two mixed water types are represented by the distances (a and b) to the new water type R. This length can easily be measured with a ruler and on the basis of the formula given in figure 2 the percentage can be calculated.
Figure 2
Reference: Evelyn Brown, Angela Colling, Dave Park, John Phillips, Dave Rothery and John Wright (2001): Ocean Circulation, Open University, p. 226
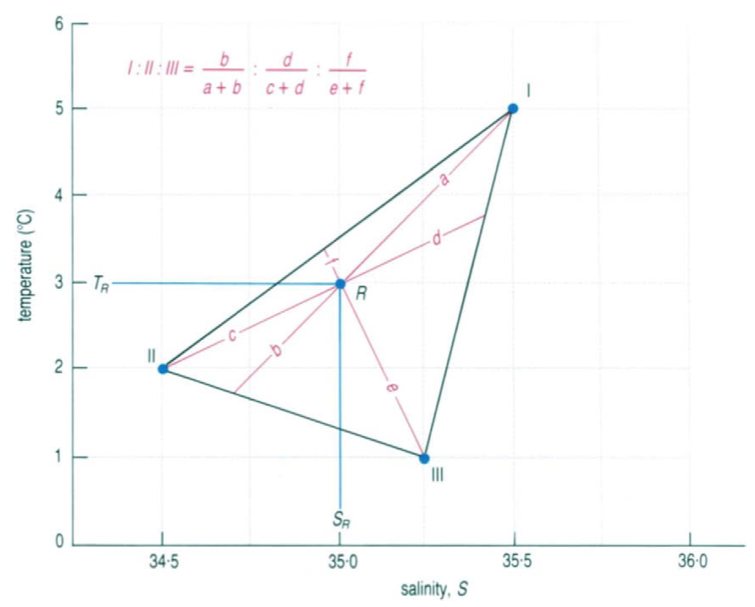
If three water types are mixed together, the mixture R has to lie inside a triangle formed by joining the three points of the given water types. Now the respective distanced can be measured with a ruler and with the red formula shown in figure 3 the respective percentage can also be calculated. In this example the mixture R consists out of approximately 40% of water type I, 45% of water type II and 15% of water type III.
Figure 3
Reference: Evelyn Brown, Angela Colling, Dave Park, John Phillips, Dave Rothery and John Wright (2001): Ocean Circulation, Open University, p. 227
Cabbeling
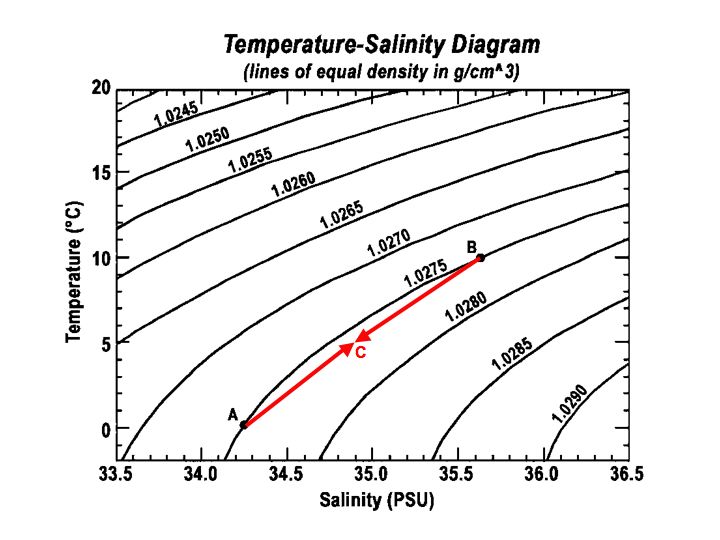
T-S diagrams are also very useful in representing mixing processes between two different water masses and especially for the process of cabbeling. When two water masses with the same density but different temperature and salinity mix, they produce a final water mass with a higher density than the two initial water masses. Because of the higher density, the final water mass sinks. This process can be shown on a T-S diagram and the final density can be deduced by taking the middle point of the two water masses. By drawing a line between the two water masses, it becomes obvious why the final water mass has a higher density than the initial ones. This is due to the shape of the isopycnic lines that are not straight, but bent, curved.
Figure 4
 Reference: http://en.wikipedia.org/wiki/Cabbeling
Variation: θ-S diagram
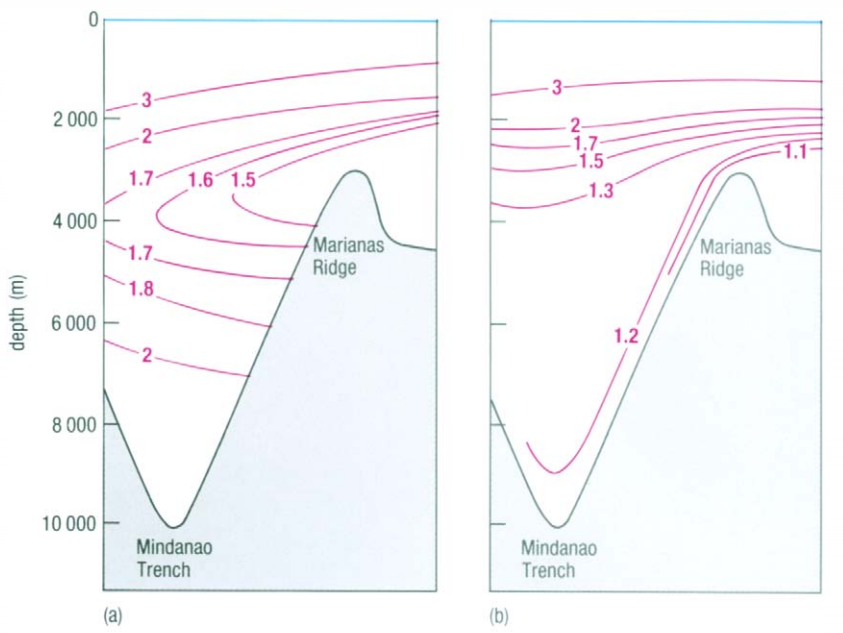
The temperature use in T-S diagrams is the in-situ temperature. It is easy to measure and works well to identify water masses, but is insufficient to evaluate the stability of water at high depth and high pressure. At those high pressures (several hundred of bars) the temperature of water is also influenced by the adiabatic compression, what induces higher temperature than what it should be without this phenomenon. The results is that it suggest a lower density and an instable profile where it is actually stable. The solution to that problem is to use the potential temperature θ that accounts for the adiabatic compression and to represent not a T-S diagram, but a θ-S diagram. In this type of diagram, the density is also expressed as the potential density (using potential temperature instead of in-situ temperature). Figure 5 shows the difference between in-situ temperature (a) and potential temperature (b). We can observe how this difference increases with depth.
Figure 5
Reference: Mark A. Suckow, Steven H. Weisbroth, Craig L. Franklin (1995). Seawater: Its Composition, Properties and Behaviour . Open University. page 46.
Volumetric θ-S diagram
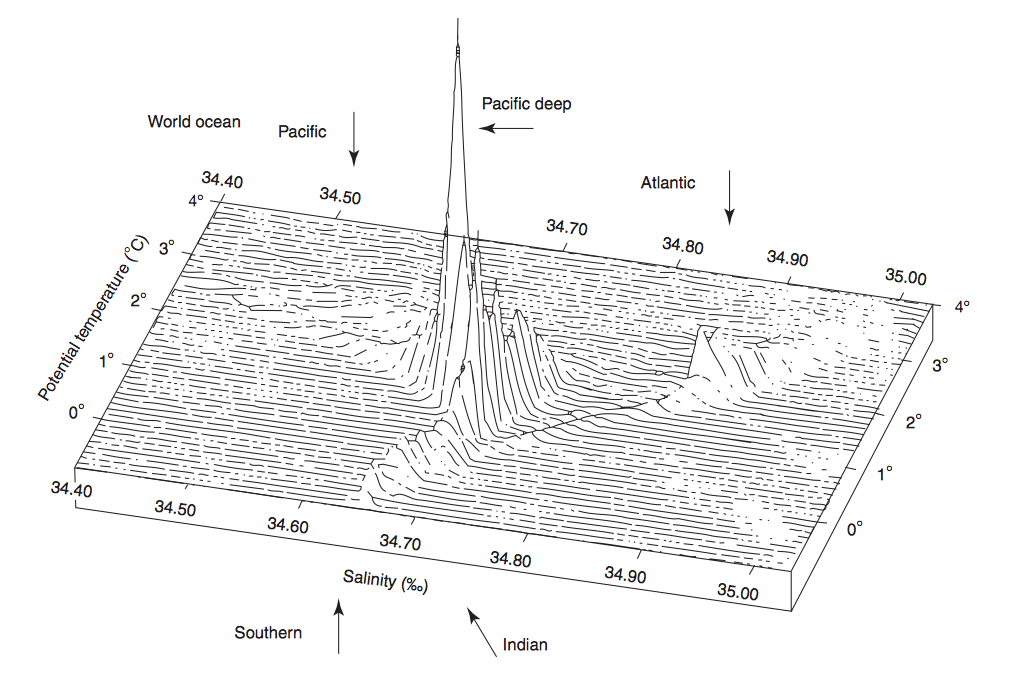
In a volumetric θ-S diagram also the salinity (X-axis) and the potential temperature (Y-axis) are represented. But on the Z-axis the volumes of the water masses are shown (look at figure 6). This computer-generated figure only can be used for water colder than 4°C. This limit is useful, because the deep water masses are by far the largest share of the ocean's water volume and their potential temperature is below 4°C. Surface waters don't appear in this diagram.
Figure 6
Reference
Reference: Mark A. Suckow, Steven H. Weisbroth, Craig L. Franklin (1995). Seawater: Its Composition, Properties and Behaviour . Open University. Butterworth Heinemann. 168 pp. ISBN: 978-0-7506-3715-2.
http://en.wikipedia.org/wiki/Cabbeling
Evelyn Brown, Angela Colling, Dave Park, John Phillips, Dave Rothery and John Wright (2001): Ocean Circulation, Open University, pp. 225
