Table of Contents
Law of the Wall
Authors: Deyan and Thomas
Edited by: Ari Feinberg
Fluid movement along a boundary
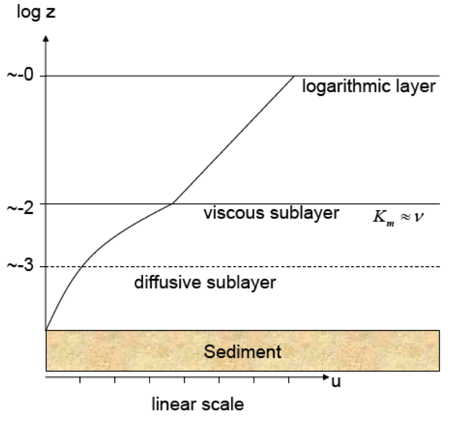
Fluids moving along a boundary follow either laminar (straight) or turbulent (mixed) flow. There are several layers within the fluid flowing along a surface boundary (Figure 1). These layers, from bottom to top, are:
| Layers | Dominating Variable(s) | Notes |
|---|---|---|
| Diffusive | Molecular diffusivity ($k_{c_i}$) | Immediately above the sediment |
| Thermal-diffusive | Thermal diffusivity ($k_T$) | - |
| Viscous | Viscosity ($\nu$) | Linear velocity profile (Figure 2). This layer may not exist, given certain types of sediment. Below this layer, the effects of the fluid interacting with the sediment become important. |
| Logarithmic | Both eddy diffusivity ($k_{turb}$) and roughness length ($z_0$) | Velocity profile discussed below |
Figure 1. Source: Münnich, M., Introduction to Oceanography, Lecture 7. 26.03.14)
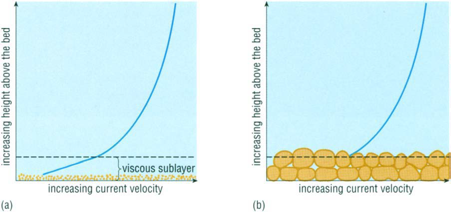 Figure 2. Source: Waves, Tides and Shallow Water Processes. (1989) Open University. Page 107.
Boundary Layer
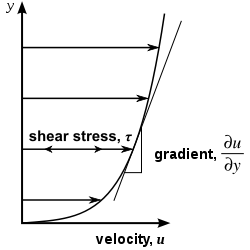
A fluid flowing near a solid surface is slowed down by friction along the boundary edge. 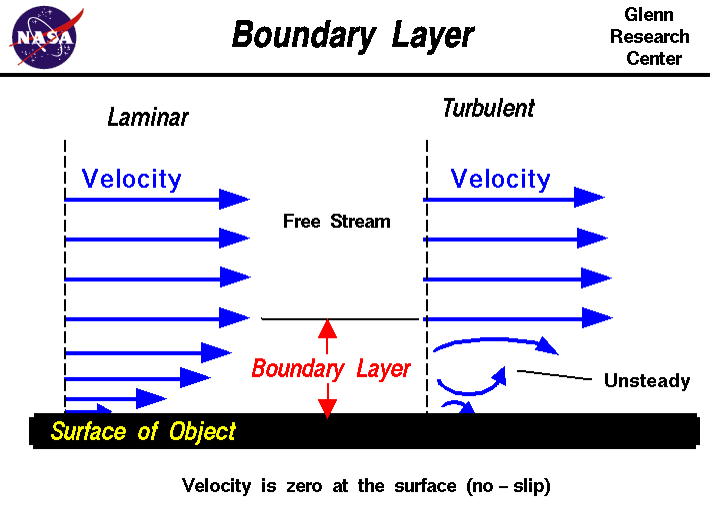 This change in current velocity is a current shear. The region of the fluid that is physically affected is called the boundary layer (Figure 3) Source: http://www.grc.nasa.gov/WWW/k-12/airplane/boundlay.html). The layer of water directly in contact with the sediment will not be moving. As you move away from the boundary (as z increases), the successive layers of water will be sliding over each other, successively less influenced by the effects of friction. The velocity of these layers therefore increases as the distance from the boundary increases. This velocity gradient is called the shear velocity and is the derivative of the fluid speed in the x-direction. (Figure 4)
Figure 4 Source: http://en.wikipedia.org/wiki/File:Laminar_shear_flow.svg)
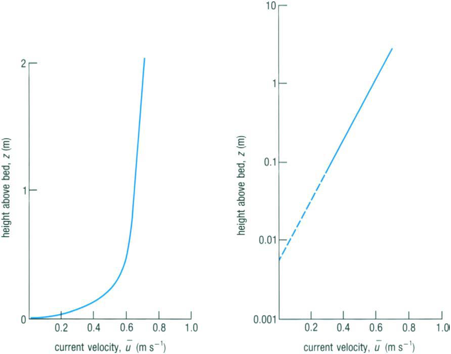
 The rate at which speed increases gradually diminishes as the distance from the edge increases. At the top of the boundary layer, the effects of friction are non-existent and the rate of velocity change is zero. This relationship is logarithmic. Figure 5a shows the velocity of water versus the height above the river/sea/lakebed in the boundary layer, while 5b is the same data on the logarithmic scale. The more vertical the line, the slower the current and the lower the shear velocity.
Figure 5 Source: Waves, Tides and Shallow Water Processes. (1989) Open University. Page 104.
Shear Stress
The frictional force exerted by one layer of water by the faster moving one above, or by the slower layer below is called the shear stress. It is denoted as $\tau$ and has N/m^2 units. It is a measure of the fluid’s viscosity, composed of two types;
U = molecular viscosity
- A property of the fluid that is constant at a given temperature
- A measure of the resistance to flow in a laminar fashion
N = Eddy viscosity
- Random component of flow due to parcels of water interacting
- Much larger component in the boundary layer
- Highly variable
In its most simple form the turbulent shear (Reynolds) stress is assumed to act like molecular stress:
<WRAP center round box>
$\tau=k\vec\nabla\overline{u}$
</WRAP>
$\tau$=Reynolds stress tensor-influence of turbulence on the mean flow
$k$=Constant, eddy diffusivity
$\overline{u}$=Mean flow velocity
The Law of the Wall
The Law of the Wall states that the velocity of turbulent flow at a point in a fluid is proportional to the logarithm of the distance from the boundary of the fluid region (the “wall”). It only applies to the boundary layer.
<WRAP center round box>
$$\bar u(z)=\dfrac{\sqrt{\tau/\rho}}{\kappa}\log\dfrac{z}{z_0}$$
</WRAP>
$\overline{u}$=Mean flow velocity
$z$=distance from the boundary (e.g. height above the sediment)
$\tau$=Reynolds stress tensor-influence of turbulence on the mean flow
$\rho$=density of the fluid
$\kappa$=Von Kármán constant which is equal to 0.41
$z_0$=Roughness Length-characteristic length scale for the shear velocity
Roughness length is related to the grain size of sediment and/or how bumpy the sea bed is. Typical roughness lengths for different surfaces are listed in the table below. Values for smooth surfaces are near zero, while very rough ones are slightly larger than 1.

Source: [Wieringa 1992]
Application in Oceanography
- The Law of the Wall offers a way to assess the effects of the boundary, or sediment, on the flow of water in an ocean, lake, or river. The current velocity above the boundary can be predicted. Also the thickness of the layer that is to be affected can be estimated.
- Furthermore, the Law of the Wall is used to determine the wind stress (bulk formula) over the ocean which is responsible for Ekman Transport by exerting shear stress on the sea surface.
