Table of Contents
The Global Warming Hiatus & the Role of the Ocean
Author: Alexandra Auderset
What is the global warming hiatus?
Global warming is a highly discussed topic in science as well as in society. The anthropogenic climate change resulting from human activities such as fossil fuel burning or changes in land use is strongly related to increasing carbon dioxide concentrations in the atmosphere. High concentrations of this greenhouse gas in the atmosphere combined with several GHGs (methane, nitrous oxide, chlorofluorocarbons) lead to a global energy imbalance. The GHGs increase the trapping of outgoing longwave radiation. This energy can be transformed into internal energy, potential energy, kinetic energy, latent energy or chemical energy. As a consequence glaciers and ice sheets start to melt and the land as well as the atmosphere heat up. More than 90% of the associated energy imbalance goes into the oceans, which induces raising temperatures and changes in the hydrological cycle. (IPCC, 2007; Trenberth, 2009; Trenberth and Fasullo, 2010).
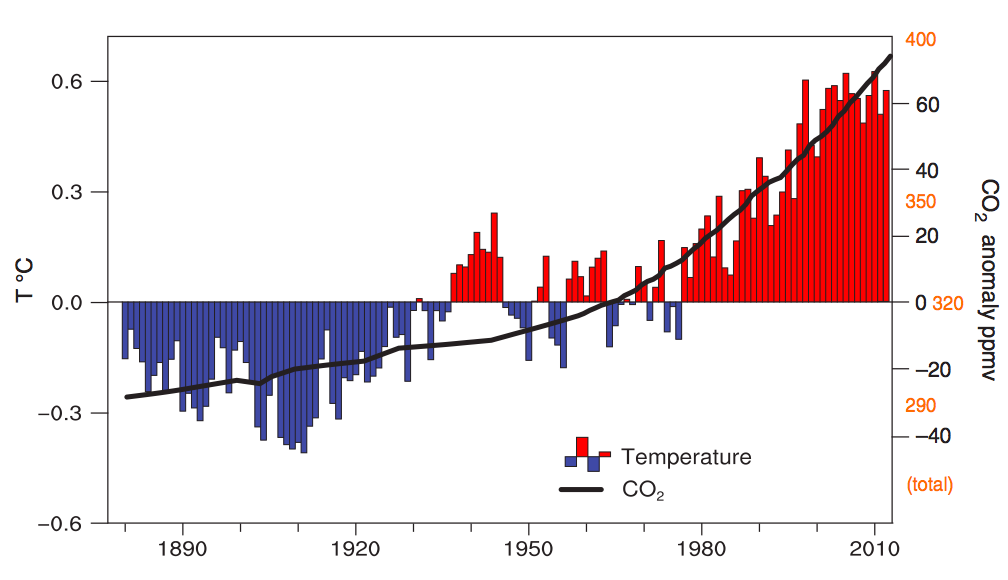
 Figure 1 Estimated changes in annual global mean surface temperatures (°C, color bars) and CO2 concentrations (thick black line) since 1880. The changes are shown as differences (anomalies) from the 1901 to 2000 average values. Carbon dioxide concentrations since 1957 are from direct measurements at Mauna Loa, Hawaii, whereas earlier estimates are derived from ice core records. The scale for CO2 concentrations is in parts per million (ppm) by volume, relative to a mean of 320ppm, whereas the temperature anomalies are relative to a mean of 13.9°C (Trenberth and Fasullo, 2013).
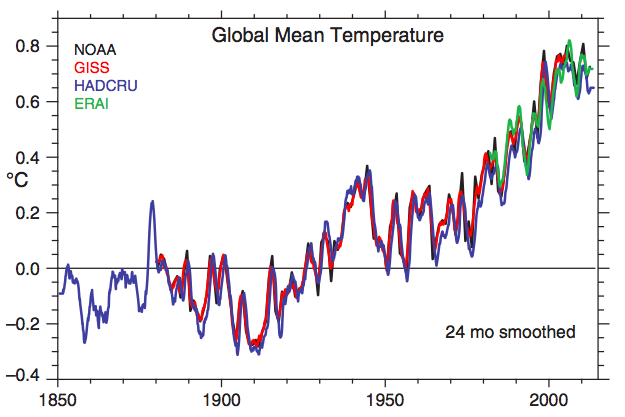
Starting in the 1970s every decade has been warmer than the previous ones. Nevertheless a slowing in the rise of global mean temperature over the past decade has been noticed. This slowing rate in the 2000s is often referred as a hiatus or a plateau.
 Figure 2 Global mean temperature time series as 24 month running means from several sources: NOAA, GISS, HADCRU, ERAI. Slowing rate in the 2000s (Trenberth and Fasullo, 2013).
Why do we not fully understand it?
However there exist a strong relationship between carbon dioxide and global mean temperature (discussed above), the ever growing concentration of CO2, together with GHGs and radiative forcing do not correlate with the slowing rise rate of the global mean temperature (Trenberth and Fasullo, 2013).
What is the potential role of the ocean heat uptake as a cause for the hiatus? Where did the heat go?
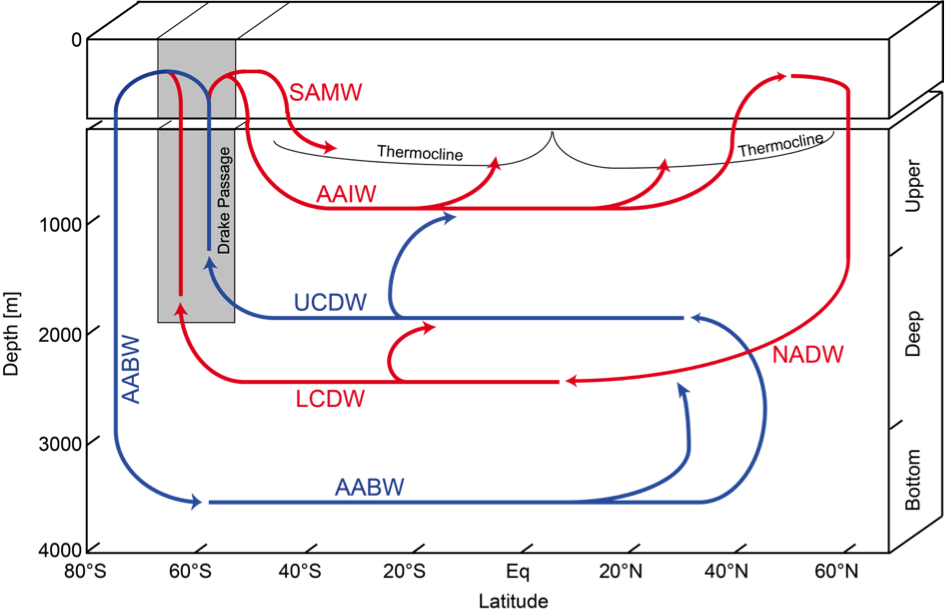
Over the last years, energy accumulated in the oceans. Water has a high heat capacity and thus the oceans are able to store the excess energy resulting from the imbalance of internal energy. Compared to the atmosphere or land (soils) the ocean stores a much larger amount of energy – ca. 93%. Heating and thermal expansion are two direct consequences for the heat storage. The Southern Ocean plays an important role in the heat storage. The uptake of the total excess heat from global warming amounts to ca. 75%. Old and cold deep water is upwelled in the Southern Ocean. Its capacity to dissolve carbon dioxide in the water induces a large uptake of CO2. The water is heated up at the surface and the subsequent Antarctic Bottom Water (AABW) formation brings the heat to the deep ocean (Lecture Slides, Physical Oceanography, 2014).
 Figure 3 Scheme of the Atlantic Ocean with its different water masses from South to North (Lecture Slides, Physical Oceanography, 2014).
What is the role of the ENSO system in this context?
There are three different possible reasons for the current hiatus in global surface temperature.
1. Missing data in temperature records
There exist only few data of global surface temperature around 1850. Data were only taken in North America, Europe and on some ships. There is still a lack of data today, e.g. in the Arctic, Southern Ocean and on the African continent.
2. Reduced trends in radiative forcing due to external factors, e.g. volcanoes
The radiative forcing is caused by CO2 and methane increases. Periods with low volcanic activity can lead to a cooling/ slowing of the temperature rise. Other playing factors are decreased water vapor content in the stratosphere or reduced CFCs and methane emission (Montreal contract).
3. Cooling contribution from internal climate variability
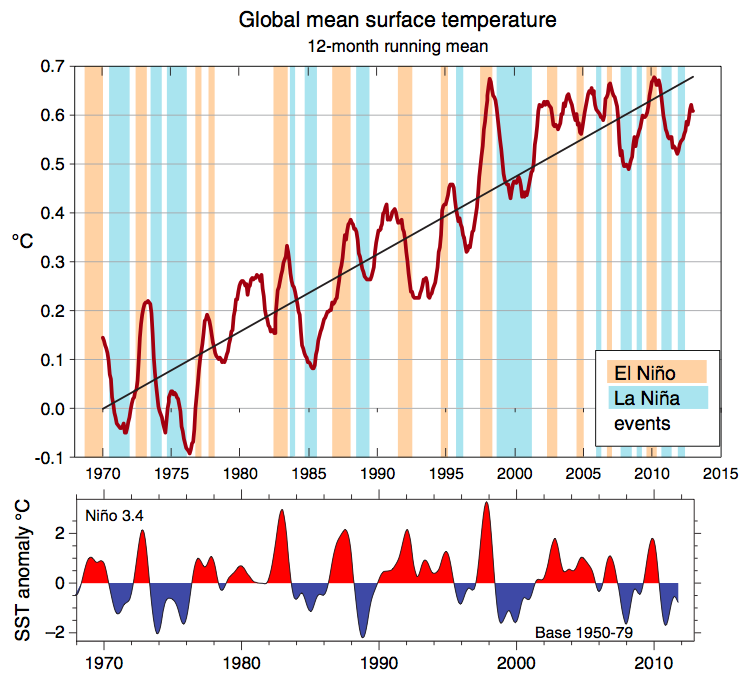
The biggest fluctuations in global mean surface temperature have been identified with ENSO (e.g. Trenberth et al., 2002). The temperatures fit pretty well with El Nino and La Nina events, which emphasises the relationship between the interannual variability and ENSO. Several studies proved this relationship by correlating ENSO short-term fluctuations with global surface temperature. Once ENSO is removed, the residual temperature time series is linear with no evidence of a hiatus (Lean and Rind, 2008, 2009; Foster and Rahmstorf, 2011).
 Figure 4 The NOAA global mean 12 month running mean surface temperatures are given relative to 1901–2000 along with a linear trend fit. Marked on the graph are the El Nin ̃o (buff) and La Nin ̃a (sky blue) periods as defined by NOAA’s ONI, based on the Nin ̃o 3.4 SST anomalies, as given in the lower panel relative to a base period of 1950–1979 (Trenberth and Fasullo, 2013).
Prominent decadal variability occurs in the Atlantic and Pacific Ocean. The Pacific Ocean seems to account for the majority of the decadal variability. A positive phase of the PDO (Pacific Decadal Oscillation) enhances the surface warming while reducing the amount of heat sequestered by the deep ocean. During a negative phase more heat gets deposited at greater depths, leading to overall warming of the oceans and cooling of the surface water. A speculation made by Balmaseda et al., 2013 is that the huge El Nino event in 1997 and 1998 triggered the change in the PDO and led to a large loss of heat in the Pacific. Such regimes can last for 25 years. Therefore the PDO is a natural and essential mode of variability concerning climate warming. Hence it is expected that the hiatus/ plateau in warming is not because global warming has ceased, but it is affected by internal climate variability (Trenberth and Fasullo, 2013).
References
Balmaseda, Magdalena A., Kevin E. Trenberth, and Erland Källén. “Distinctive climate signals in reanalysis of global ocean heat content.” Geophysical Research Letters 40.9 (2013): 1754-1759.
PCC (2007), Climate Change 2007: The Physical Science Basis. Contribution of Working Group I to the Fourth Assessment Report of the Intergovernmental Panel on Climate Change, edited by S. Solomon et al., Cambridge University Press, Cambridge, United Kingdom and New York, NY, USA.
Lean, Judith L., and David H. Rind. “How natural and anthropogenic influences alter global and regional surface temperatures: 1889 to 2006.” Geophysical Research Letters 35.18 (2008).
Lean, Judith L., and David H. Rind. “How will Earth's surface temperature change in future decades?.” Geophysical Research Letters 36.15 (2009).
Rahmstorf, Stefan, Grant Foster, and Anny Cazenave. “Comparing climate projections to observations up to 2011.” Environmental Research Letters 7.4 (2012): 044035.
Trenberth, K. E., and J. T. Fasullo (2013), An apparent hiatus in global warming? Earth’s Future, 1, 19–32, doi:10.1002/2013EF000165.
Trenberth, K. E., and J. T. Fasullo (2010), Tracking Earth’s energy, Science, 328, 316–317.
Trenberth, K. E., J. T. Fasullo, and J. Kiehl (2009), Earth’s global energy budget, Bull. Am. Meteorol. Soc., 90, 311–323.
Trenberth, K. E., J. M. Caron, D. P. Stepaniak, and S. Worley (2002), The evolution of ENSO and global atmospheric surface temperatures, J. Geophys. Res., 107(4065), D8, doi:10.1029/2000JD000298.