Table of Contents
Definitions of salinity
Author: Alexandra Auderset
The original definition of salinity is the mass of solid material (in grams) in a kilogram of seawater after evaporation of the water. This is called the “Absolute Salinity”. Since it is very hard to perform evaporation measurements, this definition is not useful (Millero et al., 2008).
→ example: average salinity of ocean water is ca. 35 grams of salts per kilogram of seawater. S = 35 g/kg = 35 = 35 ppt
The “Knudsen Salinity” describes the total amount of solid material (in grams) dissolved in one kilogram of seawater, after converting all carbonates to oxide, replacing bromine and iodine by chlorine and oxidising all organic matter. The method to determine the amount of chlorine ion (chlorinity) by titration with silver nitrate was too difficult to carry out routinely as well (Wallace, 1974).
→ Salinity = 1.800655 * Chlorinity (1)
The “Practical Salinity” is the developed definition of salinity and determined by seawaters electrical conductivity, which depends on salinity and temperature. Practical salinity is measured in psu (practical salinity units). Compared to the other salinity measurements practical salinity achieves a higher accuracy. To convert the conductivity to the practical salinity a computer subroutine (with archived data sets of salinities and conductivites) has to be used (Sverdrup et al., 1942).
▪ What definition is used when?
The absolute salinity and Knudsen salinity were used at the beginning of the 20th century to 1970 and needed chemical analyses of the seawater. The improved measurement of practical salinity evolved but its precision was depending on accurate temperature measurements in the ocean. The most recent and precise way to determine seawater absolute salinity is a combination of practical salinity with corrections. The improved information about composition of the Atlantic surface seawater and an incorporation of atomic weights, as well as a correction for the geographic dependence of dissolved matter need to be considered (Talley et al., 2011).
→ $S_{A} = S_{R} + \delta S_{A} = (35.16504 [\frac{g}{kg}]-1/35) S_{P} + \delta S_{A} $ (2)
$S_{A}$ :Absolute Salinity
$S_{R}$ :Reference Salinity (reference Atlantic surface seawater)
$S_{P}$ :Practical Salinity
$\delta S_{A}$ :geographically dependent anomaly (correction for dissolved substances that do not affect conductivity)
Global surface salinity distribution
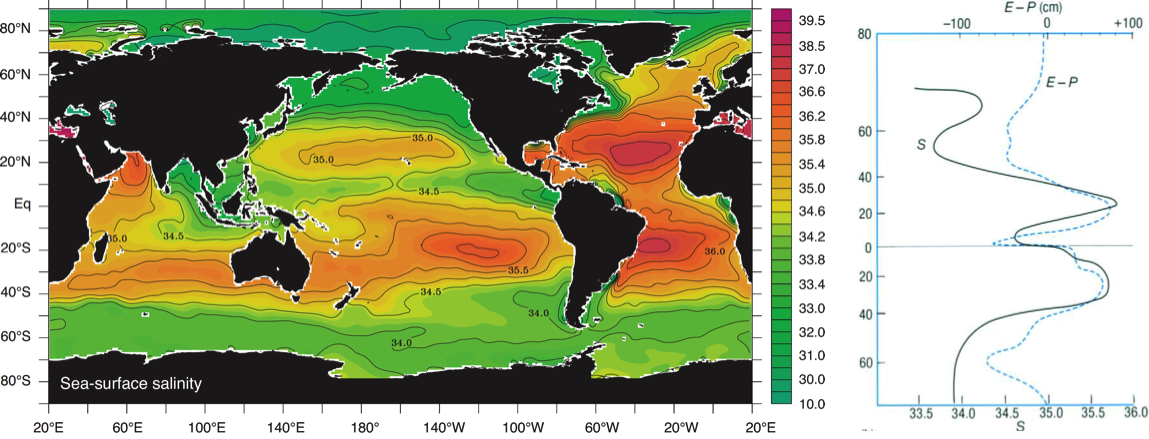
Salts are weathering products and put in the ocean primarily by river runoffs. Since weathering is a very slow geological process and the mixing time of the seawater is much shorter (around thousands of years), the dissolved elements get equally distributed in the ocean. Nevertheless one can see regional differences in total concentration of dissolved salts as a result of evaporation and dilution by freshwater from rain and river input (Talley et al., 2011).
a) Very high salinity in tropics and subtropics: More Evaporation than precipitation – freshwater evaporates and salty seawater remains in ocean.
d) Very high salinity in marginal seas: Smaller, “closed” basins undergo strong evaporation.
b) Very low salinity in polar regions: Melting ice and snow during summer.
c) Very low salinity by river deltas: Freshwater river runoff into ocean.
d) Atlantic saltier than Pacific: There is a net transport of humidity from the Atlantic to the Pacific. In constrast westerlies transport humid air from the Pacific eastwards but get blocked by the Rocky Mountains and rain out over the Pacific (Sarmiento, 2013).
NASA Aquarius mission
Sampling of ocean salinity started between 300 and 600 A.D. in the Southern Pacific Ocean, but monitoring possibilities were limited. Since 1870 scientists started a systematic mapping and methods improved over the centuries. In 2011 NASA launched Aquarius satellite, the first to be designed to screen the surface salinity of the oceans. The satellite provides informations every 7 days about the top surface salinity (1-2 cm below the surface). The sensor reveals the microwaves emission, index that is directly correlated with temperature and salinity of the water. The brighter is the plotting on the image the higher is the Kelvin change in sea temperature. The sensor accuracy is equivalent to 0.1 Kelvin that correnspond to 0.2 PSS in salinity (Ocean salinity vary between 32 and 37 PSS). Aquarium provided the first planet screen of ocean salinity in Decenber 2011. http://www.nasa.gov/mission_pages/aquarius/news/data-first-year.html
Global vertical salinity distribution
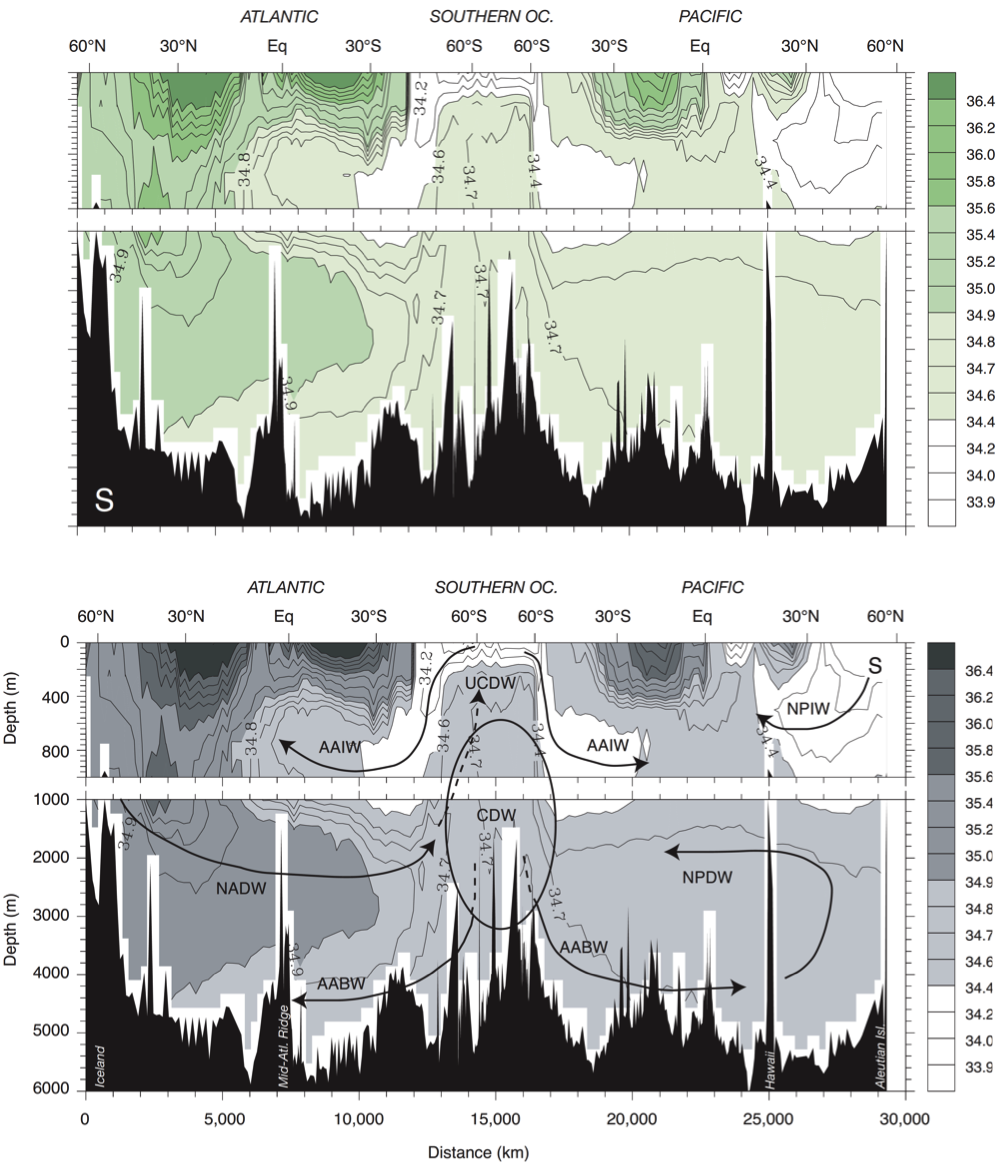
In the ocean's interior, salinity can be used as a water mass tracer, since it is a conservative tracer. A conservative tracer is a measurable compound not consumed or created by chemical or biological reactions. Salinity (together with conservative temperature) are conservative tracers in the ocean interior (but not at the Ocean surface), due to the fact there are no considerable sinks or sources in the deep oceans. At the surface, salinity is changed through exchange of freshwater and salt with the atmosphere, the cryosphere and the land. Salinity is a good tracer to follow water masses, attribute them to certain formation regions at the surface (e.g. North Atlantic) and to trace core movements. (Introduction to Physical Oceanography, Robert Stewart, Texas A&M University - Chapter 13.3 - http://oceanworld.tamu.edu/resources/ocng_textbook/chapter13/chapter13_03.htm)
The vertical distribution of salinity is layered with distinct maxima and minima in different depths. Since salinity is a conservative tracer, the signals originate at the surface and get transported through the water column by large scale meridional overturning circulation. In this context one can see in figure 2 that the density and salinity distribution in the oceans agree very well (Sarmiento, 2013). The Atlantic is characterised by a high saline surface layer (discussed in previous subchapter) and a salinity anomaly at ca. 1100m depth at a latitude of 36°N. This anomaly is due to high salinity surface waters of the Mediterranean Sea, which underlie strong evaporation and cool winter temperatures. Because of its higher density the water masses sink down and transport its signal in the lower layer and flow into the North Atlantic Basin through the strait of Gibraltar (Belkin et al., 1998). The freshwater signal at the Southern Ocean can be seen in figure 2 as well as the transport of the water masses through the Antarctic Intermediate Water (AAIW) (Sarmiento, 2013).
References
Belkin, I.M., Levitus, S., Antonov, J. and Malmberg, S.-A., 1998. “Great salinity anomalies” in the North Atlantic. Progress in Oceanography, 41(1): 1-68.
Millero, F.J., Feistel, R., Wright, D.G. and McDougall, T.J., 2008. The composition of Standard Seawater and the definition of the Reference-Composition Salinity Scale. Deep Sea Research Part I: Oceanographic Research Papers, 55(1): 50-72.
Sarmiento, J.L., 2013. Ocean biogeochemical dynamics. Princeton University Press.
Sverdrup, H.U., Johnson, M.W. and Fleming, R.H., 1942. The oceans: their physics, chemistry, and general biology, 7. Prentice-Hall New York.
Talley, L.D., Pickard, G.L., Emery, W.J. and Swift, J.H., 2011. Descriptive physical oceanography: an introduction. Academic Press.
Wallace, W.J., 1974. The development of the chlorinity/salinity concept in oceanography, 7. Elsevier.
http://www.nasa.gov/mission_pages/aquarius/spacecraft/index.html
Comments
Equation was edited Leonardo Echeverria 2014 NASA Aquarium mission added Francesco Santarella 2015

