Table of Contents
Temperature
Author: Rebecca Ritter
Revised by Evelyne Vonwyl
Definition
Temperature T is one of the most important physical characteristics of seawater. In most ocean, it determines the density of water. Temperature can be described as the thermodynamic property of a fluid resulting from activity of molecules and atoms in the fluid (Talley et al., 2011). The more activity (kinetic energy), the higher the temperature.
The Basic unit of temperature in the International System of Units (SI) is Kelvin [K]. In oceanography the temperature is usually expressed in Celsius [°C], in which the freezing point of water is about 0 °C and the boiling point about 100 °C (at sea level).
The Kelvin and Celsius scales are defined by two points: absolute zero and the triple point of Vienna Standard Mean Ocean Water (international agreement). The absolute Zero is defined as precisely 0 K and -273.15 °C at which matter contains no thermal energy. The triple point of water is defined as 273.16 K and 0.01 °C.
Another scale, Fahrenheit, is mostly used in the US. The freezing point of water corresponds to 32 °F and the boiling point to 212 °F.
For conversion of the different units, see table below.
Conversion
| to Kelvin | to Celcius |
|---|---|
| T[K] = T[°C] + 273.15 | T[°C] = T[K] − 273.15 |
| to Fahrenheit | to Celcius |
| T[°F] = T[°C] × 9⁄5 + 32 | T[°C] = (T[°F] − 32) × 5⁄9 |
Physical properties of water
The water's heat capacity (or specific heat) is the highest among all liquids except the one of ammonia (Talley et al., 2011). The heat capacity describes the amount of heat required to raise the temperature of unit mass of a substance by one degree (Lecture slides 2, 2015). Around 90% of the anthropogenic heating is stored in the ocean making it to one of the most important regulators of world's climate (Talley et al., 2011).
Water has a very high latent heat of fusion and latent heat of evaporation. The latent heat can be described as the heat required to change water from a solid to a liquid or from a liquid to a gas, respectively, without changing its temperature (Talley et al., 2011).
In-Situ Temperature vs Potential Temperature and Conservative Temperature
The In-Situ Temperature T describes the temperature that a water volume has at the specific depth where the instrument is located. At great depth the in-situ temperature increases due to compression of the parcel. These changes in temperature are unrelated to surface or deep sources of heat, therefore not relevant for measurements of the heat content of fluids. In order to compare two water parcels that are found at different depths, the Potential temperature θ is often used.
The Potential Temperature θ is the temperature that a water parcel would have if it were raised adiabatically (no heat exchange with the surrounding) from some depth to the sea surface without change in its salinity. Or in other words it is the temperature of the seawater parcel after an adiabatic and isohaline change of pressure to p = 0 dbar.
The in-situ temperature is bigger than the potential temperature (T > θ) but the difference is only at great depth meaningful (about z = -2500m).
The Conservative Temperature Θ (or CT) is proportional to potential enthalpy which is the enthalpy of a seawater parcel after the same adiabatic and isohaline change of pressure to p = 0 dbar. Conservative temperature has been introduce by the International Thermodynamic Equation Of State – 2010 (TEOS-10). It is a more accurate measure of the “heat content” of seawater, by a factor of one hundred, than its counterpart, potential temperature. In contrast to the potential temperature the conservative temperature takes into account the change of heat capacity by salinity. While differences between conservative and potential temperature can be as big as 1.4C for water with very low salinity they are for most places in the ocean quite small (<0.1C).
Temperature measurement
- Reversing (Mercury) Thermometers are used to record temperatures at depth. A glasswork system cuts of the mercury column when the thermometer is flipped upside down (Talley et al., 2011).
- Thermistors are commonly used for in-situ measurements (Talley et al. 2011). These are semiconductors that have resistance varying with the water temperature (Oceanworld).
- Satellites for sea surface temperature are used for detection of thermal infrared electromagnetic radiation. Satellite-mounted infrared sensors are able to measure the change of sea surface temperature on a global scale, both seasonally and from year to year. Satellite-based instruments cannot discover anything about the depth-related temperature structure of the oceans.
Global Sea Temperature
Sea Surface Temperature
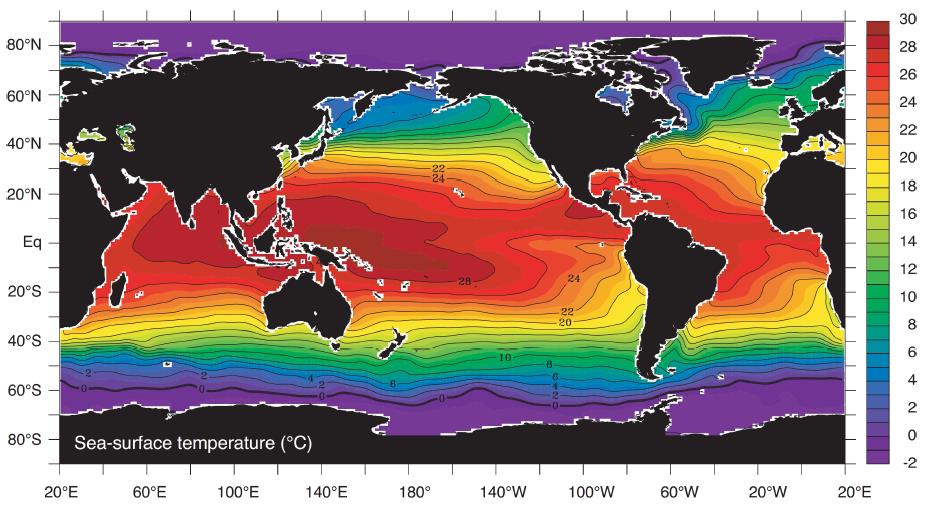
Interaction of the ocean and the atmosphere occur at the sea surface, determining the overall pattern of sea surface temperature (SST). A high SST is found at low latitudes due to net heating, and a low SST at high latitudes due to net cooling. Complex features of temperature distribution represented in the figure below can mainly be explained by patterns of ocean circulation and spatial variations in atmospheric forcing (Talley et al., 2011).
Interpretation of the figure:
- at 80ºW and 30ºS: the cold area is due to Ekman Transport away from the coast and subsequent upwelling
- along the coasts the temperature pattern differ: at the same latitude (e.g. 30ºN) in western boundaries (e.g. 130ºE) it is warmer than in eastern boundaries (e.g. 120ºW)
- the ocean's temperature ranges from around -1.7°C (freezing point that depends on salinity) to around 30°C in the tropical regions
- warmest water: equator and western side of basin (e.g. Western Pacific Warm Pool)
- coldest water: near poles and eastern side of basin
The SST depends mainly on Insolation, Conduction, Convection, Evaporation/Precipitation and Aerosol production.
Annual range of sea surface temperature
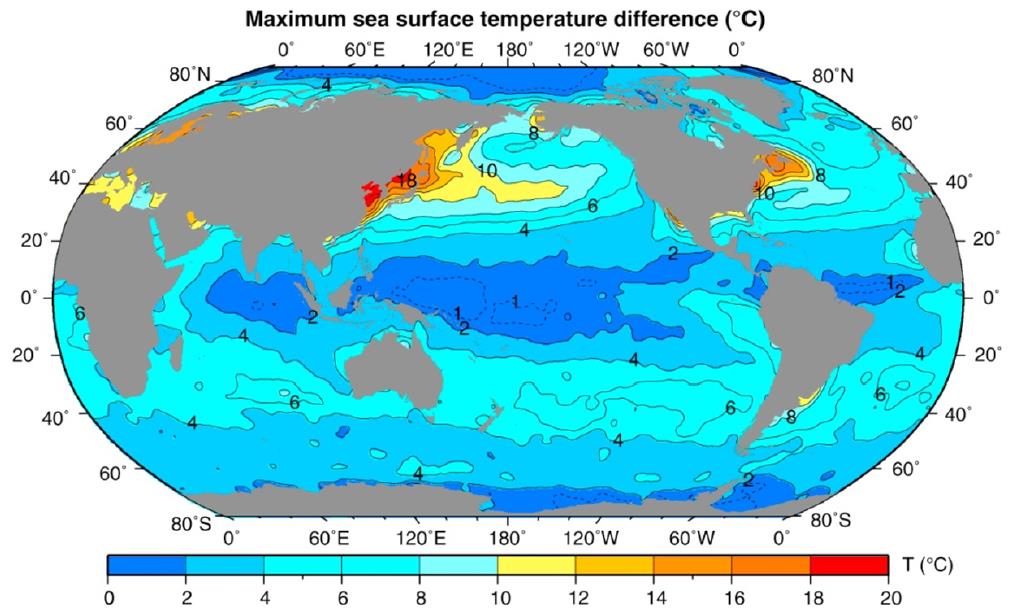
In oceanography the variation in SST is of a high interest. In the figure below the SST differences are shown.
Interpretation of the figure:
- the annual range is highest at mid-latitudes in the Northern Hemisphere, especially on the western coast; cold air blows off the continents in winter and cools the ocean
- the maximum SST difference (around 18 ºC) is in the Sea of Japan/South China Sea
- the Poles and the Equator are regions with no or only a slight temperature variation.
Vertical sections of temperature
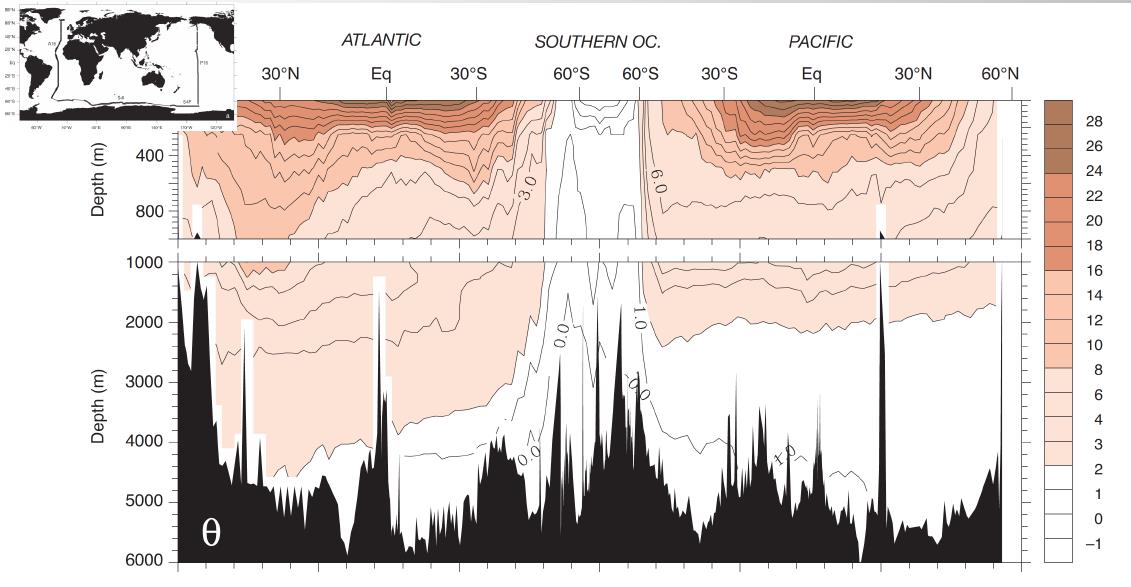
The figure below shows a vertical section of the Potential temperature.
Interpretation of the figure:
- in the Southern Ocean there is strong mixing; this section reveals a constant temperature of around 0-1°C
- the deep ocean (below a depth of 1-2 km) has a relatively uniform temperature
- high-latitude regions in the Northern hemisphere (Atlantic and Pacific) have temperature similar to the deep ocean
- mid- and low-latitudes have steep temperature gradient
Schematic Illustration of Thermocline
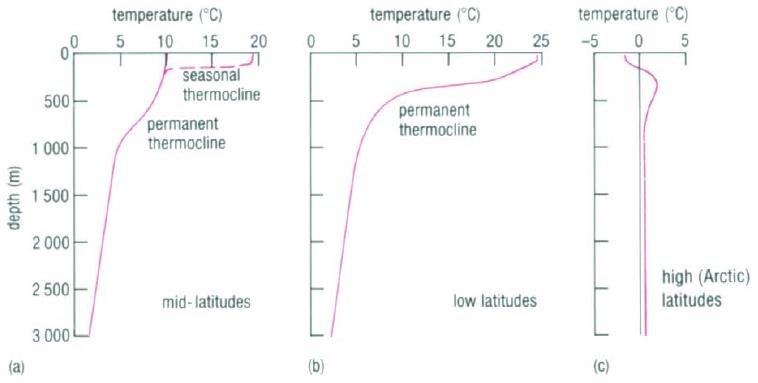
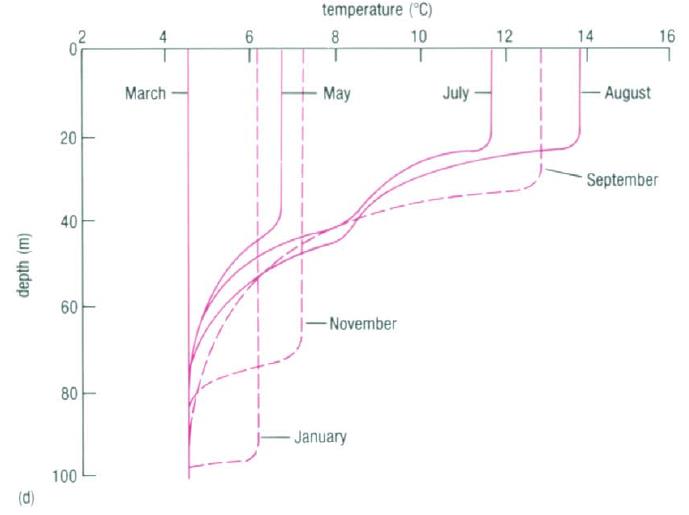
Below the surface layer there are often water masses with relatively uniform temperature due to mixing (Mixed layers). Seasonal variations result in variable thickness of this layer. Then temperature begins to decrease rapidly with depth (Permanent Thermocline). After several hundred meters, the temperature decrease ceases (Abyssal layer) and this layer extends down to the bottom (Talley et al., 2011). The figure below represents typical mean temperature profiles for different latitudes (figure a.-c.) and the growth (solid lines) and decay (broken lines) of seasonal thermocline in the Northern Hemisphere (figure d.).
Interpretation of the figure:
- Figure b): In low latitudes, there is no winter cooling, so the seasonal thermocline becomes permanent and merges with the permanent thermocline at depths of 100-150m
- Figure c): At hight latitudes greater than about 60º there is no permanent thermocline (although seasonal thermoclines can still develop in summer)
- Figure d): Winter cooling and strong winds progressively increase the depth of seasonal thermoclines and reduce the temperature gradient
Reference
- Thomas Frölicher (2014). Introduction to Physical Oceanography. Lesson 26.2.2014.
- Lecture slides 2 (25.02.15). Introduction to Physical Oceanography.
- Mark A. Suckow, Steven H. Weisbroth, Craig L. Franklin (1995). Seawater: Its Composition, Properties and Behaviour . Open University. Chapter 2.
- Talley L., Pickard G., Emery J., Swift J. (2011). Descriptive Physical Oceanography. 6th edition. Academic Press.
- http://oceanworld.tamu.edu (27.02.15)
